Market Outlook
January 05, 2017
Market Cues
Domestic Indices
Chg (%)
(Pts)
(Close)
Indian markets are likely to open positive tracking SGX Nifty and global cues.
BSE Sensex
(0.0)
(10)
26,633
The US markets moved higher and closed with decent gain on Wednesday as
Nifty
(0.0)
(2)
8,191
upbeat economic data came from around the globe. The strength in the market also
Mid Cap
(0.1)
(11)
12,195
came following the release of the minute of the Federal Reserve’s last monetary
Small Cap
0.5
58
12,373
policy meeting, where it was indicated that the decision to raise rates by a quarter
point was partly due to an assumption of more expansiory fiscal policy under
Bankex
(0.8)
(170)
20,446
President elect Donald Trump. European markets started the day with a positive
note, however closed on flat note as retailers reported a mixed sales data.
Global Indices
Chg (%)
(Pts)
(Close)
Indian markets traded in a narrow range on Wednesday also flattish services PMI
Dow Jones
0.3
60
19,942
data for December 2016 impacted the sentiment. Auto stocks were in favor today
Nasdaq
0.9
48
5,477
while cement stocks remained weak during the day. Index heavy weight Reliance
FTSE
0.2
12
7,190
Industries also remained weak during the trading session.
Nikkei
2.5
480
19,594
News Analysis
Hang Seng
(0.1)
(16)
22,134
Services PMI for December at 46.8
Shanghai Com
0.7
23
3,159
HDFC Bank cuts lending rates by 90 bps
Detailed analysis on Pg2
Advances / Declines
BSE
NSE
Investor’s Ready Reckoner
Advances
1,613
939
Key Domestic & Global Indicators
Declines
1,197
655
Unchanged
130
85
Stock Watch: Latest investment recommendations on 150+ stocks
Refer Pg5 onwards
Volumes (` Cr)
Top Picks
BSE
2,609
CMP
Target
Upside
Company
Sector
Rating
(`)
(`)
(%)
NSE
17,475
Amara Raja Batteries Auto & Auto Ancillary
Buy
899
1,167
29.9
Alkem Laboratories
Pharmaceuticals
Buy
1,667
1,989
19.3
Net Inflows (` Cr)
Net
Mtd
Ytd
HCL Tech
IT
Buy
859
1,000
16.4
FII
(800)
(9295)
17,983
Power Grid Corp.
Power
Buy
186
223
19.8
MFs
427
6,850
45,035
Navkar Corp.
Others
Buy
169
265
57.1
More Top Picks on Pg3
Top Gainers
Price (`)
Chg (%)
Key Upcoming Events
Jpassociat
10
19.2
Previous
Consensus
Date
Region
Event Description
Reading
Expectations
Jubilant
715
12.1
Jan 05 Germany PMI Manufacturing
53.8
53.8
Jpinfratec
8
9.4
Jan 06 Euro Zone Euro Zone Consumer Confidence
(5.1)
(5.3)
Gvkpil
6
6.9
Jan 06 China
Consumer price Index (YoY)
2.3
2.3
Den
72
6.5
Jan 10 US
Unemployment rate
4.6
4.7
More Events on Pg4
Top Losers
Price (`)
Chg (%)
Manappuram
69
(4.2)
Cumminsind
809
(4.1)
Naukri
859
(3.6)
Divislab
753
(3.3)
Raymond
508
(3.3)
As on January 04, 2017
Market Outlook
January 05, 2017
News Analysis
Services PMI at 46.8 in December compared to 46.7 in Nov. 2016
The Nikkei/ Markit Services Purchasing Managers Index remained almost static at
46.8 for the month of December 2016 compared to 46.7 in November 2016. The
cash crunch post demonetisation had impacted the number and the impact was
visible in December as well. A closer look at the service PMI shows that hotels and
restaurants were the most affected. As per Markit though, there are expectations of
rebound in demand coming in 12 months, worries toward the speed of the
recovery following the cash recall hampered confidence.
HDFC Bank cuts lending rates by 90 bps
Joining the competition India’s 2nd largest pvt bank HDFC has aggressively cut its
lending rates by 75-90 bps. The 90 bps cut in MCLR based lending rates by SBI
has changed the environment for the entire banking industry and almost all the
leading banks have slashed their lending rates.
HDFC Bank has been the most consistent performer among banks in India with
steady 20% YoY growth. While there a marginal deceleration in the growth in loan
book at 18.1% for Q2FY17, it still was one of the best among the large banks in
India. During the quarter the bank had reported a 19.6% growth in NII and 20.4%
growth in PAT. HDFC Bank continues to maintain one of the best asset qualities
among large banks and with a focus on retail lending the asset quality is likely to
remain strong in the coming quarters as well.
With the recent rate cut HDFC bank will be able to meet the competition and
continue to grow its loan book aggressively. High asset quality and consistency are
the key drivers for the stock. At the CMP the stock is trading at 3x its FY18E BV and
we have an ACCUMULATE rating on the stock.
Economic and Political News
Honda Cars sales decline 18.6% to 10,071
TRAI releases consultation paper on net neutrality
Advance GDP estimates may not fully capture demonetization effect
GST deadlock continues over dual control
Rationalize taxes, simplify procedures in Budget, says FCCI
Corporate News
Maruti opens online booking for upcoming model Ignis
HCL Tech completes acquisition of Butler America
Novelis - subsidiary of Hindalco taps Asian Banks to refinance $ 1.8 Bn term
loans
Market Outlook
January 05, 2017
Top Picks ★★★★★
Large Cap
Market Cap
CMP
Target
Upside
Company
Rationale
(` Cr)
(`)
(`)
(%)
To outpace battery industry growth due to better
Amara Raja Batteries
15,348
899
1,167
29.9
technological products leading to market share gains in both
the automotive OEM and replacement segments.
Strong growth in domestic business due to its leadership in
Alkem Laboratories
19,936
1,667
1,989
19.3
acute therapeutic segment. Alkem expects to launch more
products in USA, which bodes for its international business.
The stock is trading at attractive valuations and is factoring all
HCL Tech
1,21,225
859
1,000
16.4
the bad news.
Back on the growth trend, expect a long term growth of 14%
Infosys
2,29,304
998
1,249
25.1
to be a US$20bn in FY2020.
Strong order backlog and improvement in execution would
Larsen & Tourbo
1,28,336
1,376
1,634
18.8
trigger the growth for the L&T
One of the largest pharma companies with strong
Lupin
67,459
1,494
1,809
21.1
international presence. It has a rich pipeline of ANDAs which
is also one of the largest among the generic companies.
Going forward, we expect the company to report strong top-
Power Grid Corporation
97,386
186
223
19.8
line CAGR of ~16% and bottom-line CAGR of ~19% over
FY16-18 on back of strong capitalization guidance
Source: Company, Angel Research
Mid Cap
Market Cap
CMP
Target
Upside
Company
Rationale
(` Cr)
(`)
(`)
(%)
We expect the company would report strong profitability
Asian Granito
713
237
351
48.1
owing to better product mix, higher B2C sales and
amalgamation synergy.
Among the top 4 players in the consumer durables segment.
Bajaj Electricals
2,293
227
274
20.8
Improved profitability backed by turn around in E&P segment.
Strong order book lends earnings visibility.
Favourable outlook for the AC industry to augur well for
Cooling products business which is out pacing the market
Blue Star
4,707
493
634
28.7
growth. EMPPAC division's profitability to improve once
operating environment turns around.
With a focus on the low and medium income (LMI) consumer
Dewan Housing Finance
7,615
243
350
43.9
segment, the company has increased its presence in tier-II &
III cities where the growth opportunity is immense.
Strong loan growth backed by diversified loan portfolio and
Equitas Holdings
4,984
149
235
58.1
adequate CAR. ROE & ROA likely to remain decent as risk of
dilution remains low. Attractive valuations considering growth.
Economic recovery to have favourable impact on advertising
& circulation revenue growth. Further, the acquisition of a
Jagran Prakashan
5,912
181
225
24.4
radio business (Radio City) would also boost the company's
revenue growth.
Speedier execution and speedier sales, strong revenue visibilty
Mahindra Lifespace
1,484
362
522
44.4
in short-to-long run, attractive valuations
We expect the company to report strong growth on back of
healthy growth in domestic branded sales (owing to
Mirza International
1,089
91
107
18.2
aggressive ad spend and addition in the number of EBOs &
multi-brand outlets [MBOs]) and healthy export revenues.
Massive capacity expansion along with rail advantage at ICD
Navkar Corporation
2,405
169
265
57.1
as well CFS augurs well for the company
Strong brands and distribution network would boost growth
Siyaram Silk Mills
1,303
1,390
1,605
15.5
going ahead. Stock currently trades at an inexpensive
valuation.
Market leadership in Hindi news genre and no. 2 viewership
ranking in English news genre, exit from the radio business,
TV Today Network
1,674
281
385
37.2
and anticipated growth in ad spends by corporates to benefit
the stock.
Source: Company, Angel Research
Market Outlook
January 05, 2017
Key Upcoming Events
Global economic events release calendar
Date
Time
Country
Event Description
Unit
Period
Bloomberg Data
Last Reported Estimated
Jan 5, 2017
2:25PM
Germany
PMI Services
Value
Dec F
53.80
53.80
Jan 6, 2017
3:30PM
Euro Zone
Euro-Zone Consumer Confidence
Value
Dec F
(5.10)
(5.30)
7:00AM
China
Consumer Price Index (YoY)
% Change
Dec
2.30
2.30
7:00PM
US
Change in Nonfarm payrolls
Thousands
Dec
178.00
178.00
Jan 10, 2017
7:00PM
US
Unnemployment rate
%
Dec
4.60
4.70
India
Imports YoY%
% Change
Dec
10.40
--
India
Exports YoY%
% Change
Dec
2.30
--
Jan 11, 2017
3:00PM
UK
Industrial Production (YoY)
% Change
Nov
(1.10)
--
Jan 12, 2017
5:30PM
India
Industrial Production YoY
% Change
Nov
(1.90)
--
Jan 13, 2017
China
Exports YoY%
% Change
Dec
(1.60)
(3.00)
US
Producer Price Index (mom)
% Change
Dec
--
--
Jan 16, 2017
12:00PM
India
Monthly Wholesale Prices YoY%
% Change
Dec
3.15
--
Jan 17, 2017
3:00PM
UK
CPI (YoY)
% Change
Dec
1.20
--
Jan 18, 2017
7:00PM
US
Consumer price index (mom)
% Change
Dec
0.20
--
3:00PM
UK
Jobless claims change
% Change
Dec
2.40
--
3:30PM
Euro Zone
Euro-Zone CPI (YoY)
%
Dec F
0.60
--
7:45PM
US
Industrial Production
%
Dec
(0.44)
--
Jan 19, 2017
7:00PM
US
Housing Starts
Thousands
Dec
1,090.00
--
7:00PM
US
Building permits
Thousands
Dec
1,212.00
--
6:15PM
Euro Zone
ECB announces interest rates
%
Jan 19
--
--
Jan 20, 2017
7:30AM
China
Industrial Production (YoY)
% Change
Dec
6.20
--
7:30AM
China
Real GDP (YoY)
% Change
4Q
6.70
--
Jan 24, 2017
8:30PM
US
Existing home sales
Million
Dec
5.61
--
2:00PM
Germany
PMI Manufacturing
Value
Jan P
55.60
--
Jan 26, 2017
8:30PM
US
New home sales
Thousands
Dec
592.00
--
7:00PM
US
GDP Qoq (Annualised)
% Change
4Q A
3.50
--
Source: Bloomberg, Angel Research
Market Outlook
January 05, 2017
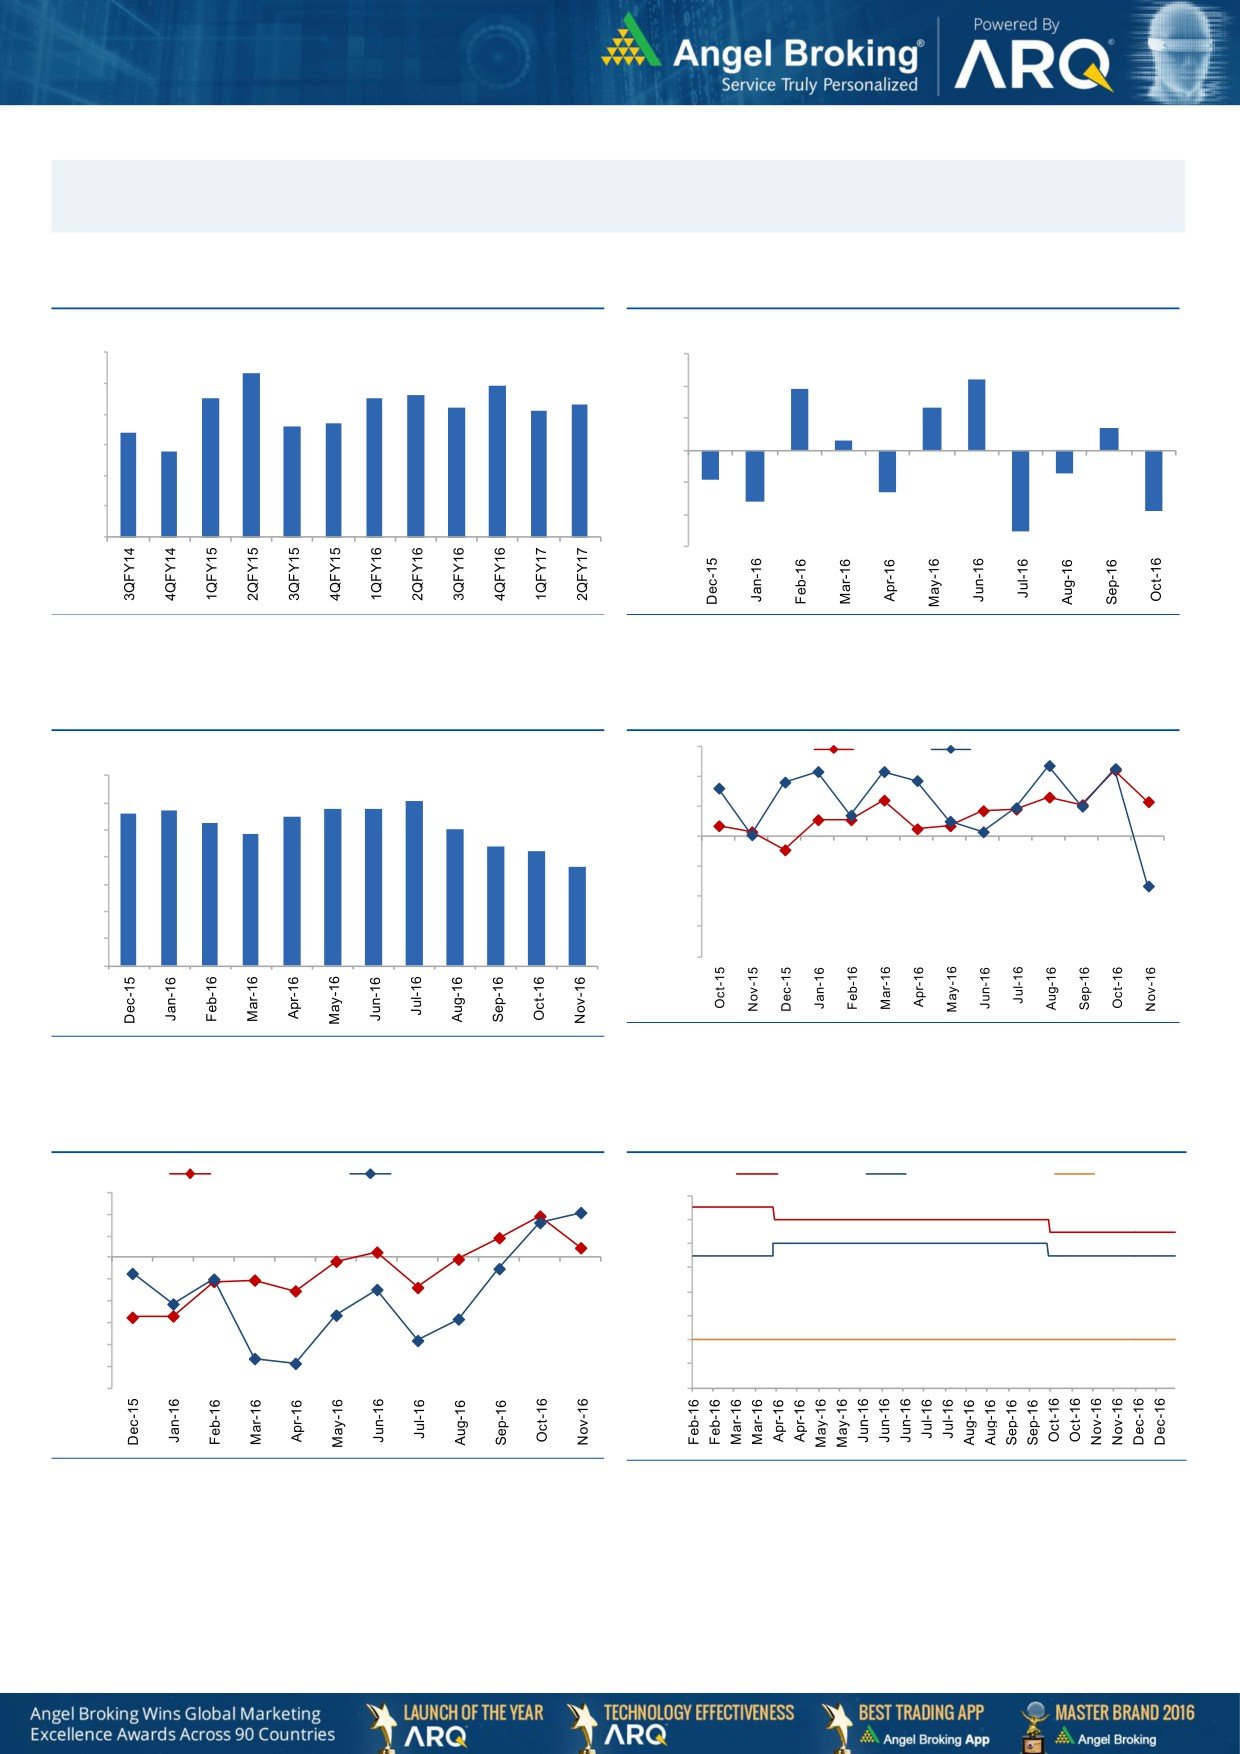
Macro watch
Exhibit 1: Quarterly GDP trends
Exhibit 2: IIP trends
(%)
(%)
9.0
8.3
3.0
2.2
7.9
1.9
7.5
7.5
7.6
8.0
7.3
2.0
7.2
7.1
1.3
6.6
6.7
0.7
7.0
6.4
1.0
0.3
5.8
6.0
-
5.0
(1.0)
(0.7)
(0.9)
4.0
(1.3)
(2.0)
(1.6)
(1.9)
3.0
(3.0)
(2.5)
Source: CSO, Angel Research
Source: MOSPI, Angel Research
Exhibit 3: Monthly CPI inflation trends
Exhibit 4: Manufacturing and services PMI
56.0
Mfg. PMI
Services PMI
(%)
7.0
54.0
6.1
5.6
5.7
5.8
5.8
6.0
5.3
5.5
52.0
5.1
4.8
5.0
4.4
4.2
50.0
3.6
4.0
48.0
3.0
46.0
2.0
44.0
1.0
42.0
-
Source: Market, Angel Research; Note: Level above 50 indicates expansion
Source: MOSPI, Angel Research
Exhibit 5: Exports and imports growth trends
Exhibit 6: Key policy rates
(%)
Exports yoy growth
Imports yoy growth
(%)
Repo rate
Reverse Repo rate
CRR
15.0
7.00
10.0
6.50
5.0
6.00
0.0
5.50
(5.0)
5.00
(10.0)
4.50
(15.0)
(20.0)
4.00
(25.0)
3.50
(30.0)
3.00
Source: Bloomberg, Angel Research
Source: RBI, Angel Research
Stock Watch
January 05, 2017
Company Name
Reco
CMP
Target
Mkt Cap
Sales ( Čcr )
OPM(%)
EPS (Č)
PER(x)
P/BV(x)
RoE(%)
EV/Sales(x)
(Č)
Price ( Č)
( Č cr )
FY17E FY18E
FY17E
FY18E
FY17E
FY18E
FY17E
FY18E
FY17E
FY18E
FY17E
FY18E
FY17E
FY18E
Agri / Agri Chemical
Rallis
Accumulate
202
209
3,936
1,937
2,164
13.3
14.3
9.0
11.0
22.5
18.4
3.9
3.4
18.4
19.8
2.0
1.7
United Phosphorus
Accumulate
667
684
33,829
15,176
17,604
18.5
18.5
37.4
44.6
17.8
15.0
3.5
2.9
21.4
21.2
2.3
1.9
Auto & Auto Ancillary
Ashok Leyland
Buy
84
111
23,863
22,407
26,022
10.6
10.6
5.2
6.4
16.1
13.1
3.6
3.1
23.6
24.7
1.1
0.9
Bajaj Auto
Neutral
2,689
-
77,798
25,093
27,891
19.5
19.2
143.9
162.5
18.7
16.6
5.2
4.5
30.3
29.4
2.8
2.4
Bharat Forge
Neutral
913
-
21,263
7,726
8,713
20.5
21.2
35.3
42.7
25.9
21.4
4.8
4.3
18.9
20.1
2.8
2.4
Eicher Motors
Neutral
22,197
-
60,382
16,583
20,447
17.5
18.0
598.0
745.2
37.1
29.8
12.7
9.7
41.2
38.3
3.4
2.7
Gabriel India
Buy
110
130
1,573
1,544
1,715
9.0
9.3
5.4
6.3
20.3
17.4
3.8
3.4
18.9
19.5
1.0
0.8
Hero Motocorp
Buy
3,014
3,541
60,192
30,958
34,139
15.7
15.7
193.6
208.3
15.6
14.5
6.1
5.0
34.2
30.5
1.8
1.6
Jamna Auto Industries Neutral
181
-
1,440
1,486
1,620
9.8
9.9
15.0
17.2
12.1
10.5
2.6
2.2
21.8
21.3
1.0
0.9
L G Balakrishnan & Bros Neutral
573
-
899
1,302
1,432
11.6
11.9
43.7
53.0
13.1
10.8
1.9
1.7
13.8
14.2
0.7
0.7
Mahindra and Mahindra Neutral
1,221
-
75,845
46,534
53,077
11.6
11.7
67.3
78.1
18.1
15.6
3.0
2.6
15.4
15.8
1.6
1.3
Maruti
Accumulate
5,510
6,006
166,433
68,057
82,958
15.8
15.5
212.1
261.2
26.0
21.1
5.2
4.3
19.8
20.3
2.0
1.6
Minda Industries
Neutral
315
-
2,501
2,728
3,042
9.0
9.1
68.2
86.2
4.6
3.7
1.1
0.8
23.8
24.3
0.9
0.8
Motherson Sumi
Neutral
321
-
45,000
45,896
53,687
7.8
8.3
13.0
16.1
24.6
19.9
7.9
6.3
34.7
35.4
1.1
0.9
Rane Brake Lining
Neutral
995
-
788
511
562
11.3
11.5
28.1
30.9
35.4
32.2
5.4
4.9
15.3
15.0
1.7
1.5
Setco Automotive
Neutral
37
-
495
741
837
13.0
13.0
15.2
17.0
2.4
2.2
0.4
0.4
15.8
16.3
1.1
1.0
Tata Motors
Neutral
487
-
140,462
300,209
338,549
8.9
8.4
42.7
54.3
11.4
9.0
1.8
1.5
15.6
17.2
0.6
0.5
TVS Motor
Neutral
374
-
17,785
13,390
15,948
6.9
7.1
12.8
16.5
29.3
22.6
7.3
5.8
26.3
27.2
1.3
1.1
Amara Raja Batteries
Buy
899
1,167
15,348
5,504
6,605
17.6
17.5
33.4
40.9
26.9
22.0
5.9
4.8
22.1
22.0
2.7
2.2
Exide Industries
Neutral
182
-
15,479
7,439
8,307
15.0
15.0
8.1
9.3
22.5
19.6
3.2
2.8
14.3
16.7
1.7
1.5
Apollo Tyres
Buy
185
235
9,432
12,877
14,504
14.3
13.9
21.4
23.0
8.7
8.1
1.3
1.2
16.4
15.2
0.9
0.8
Ceat
Buy
1,183
1,450
4,785
7,524
8,624
13.0
12.7
131.1
144.3
9.0
8.2
1.7
1.4
19.8
18.6
0.7
0.6
JK Tyres
Neutral
116
-
2,639
7,455
8,056
15.0
15.0
21.8
24.5
5.3
4.8
1.1
0.9
22.8
21.3
0.5
0.4
Swaraj Engines
Neutral
1,331
-
1,654
660
810
15.2
16.4
54.5
72.8
24.4
18.3
7.6
6.9
31.5
39.2
2.3
1.8
Subros
Neutral
165
-
989
1,488
1,681
11.7
11.9
6.4
7.2
25.8
23.0
2.7
2.5
10.8
11.4
0.9
0.8
Indag Rubber
Neutral
182
-
479
286
326
19.8
16.8
11.7
13.3
15.6
13.7
2.6
2.5
17.8
17.1
1.3
1.2
Capital Goods
ACE
Neutral
47
-
467
709
814
4.1
4.6
1.4
2.1
33.7
22.5
1.4
1.3
4.4
6.0
0.8
0.7
BEML
Neutral
1,006
-
4,188
3,451
4,055
6.3
9.2
31.4
57.9
32.0
17.4
1.9
1.8
6.3
10.9
1.3
1.1
Bharat Electronics
Neutral
1,432
-
31,990
8,137
9,169
16.8
17.2
58.7
62.5
24.4
22.9
3.8
3.4
44.6
46.3
2.8
2.5
Stock Watch
January 05, 2017
Company Name
Reco
CMP
Target
Mkt Cap
Sales ( Čcr )
OPM(%)
EPS (Č)
PER(x)
P/BV(x)
RoE(%)
EV/Sales(x)
(Č)
Price ( Č)
( Č cr )
FY17E
FY18E
FY17E
FY18E
FY17E
FY18E
FY17E
FY18E
FY17E
FY18E
FY17E
FY18E
FY17E
FY18E
Capital Goods
Voltas
Buy
335
407
11,075
6,511
7,514
7.9
8.7
12.9
16.3
26.0
20.5
4.7
4.1
16.7
18.5
1.4
1.2
BGR Energy
Neutral
125
-
905
16,567
33,848
6.0
5.6
7.8
5.9
16.1
21.3
0.9
0.9
4.7
4.2
0.2
0.1
BHEL
Neutral
127
-
31,109
28,797
34,742
-
2.8
2.3
6.9
55.3
18.4
0.9
0.9
1.3
4.8
0.7
0.5
Blue Star
Buy
493
634
4,707
4,283
5,077
5.9
7.3
14.9
22.1
33.1
22.3
6.4
5.4
20.4
26.4
1.1
0.9
Crompton Greaves
Neutral
61
-
3,829
5,777
6,120
5.9
7.0
3.3
4.5
18.5
13.6
0.8
0.8
4.4
5.9
0.6
0.5
Greaves Cotton
Neutral
122
-
2,981
1,755
1,881
16.8
16.9
7.8
8.5
15.7
14.4
3.1
2.9
20.6
20.9
1.4
1.3
Inox Wind
Neutral
183
-
4,068
5,605
6,267
15.7
16.4
24.8
30.0
7.4
6.1
2.1
1.5
25.9
24.4
0.8
0.6
KEC International
Neutral
144
-
3,710
9,294
10,186
7.9
8.1
9.9
11.9
14.6
12.1
2.1
1.9
15.6
16.3
0.6
0.6
KEI Industries
Buy
125
153
974
2,574
2,921
10.4
10.0
10.1
11.8
12.4
10.6
2.2
1.8
17.7
17.4
0.6
0.5
Thermax
Neutral
780
-
9,298
5,421
5,940
7.3
7.3
25.7
30.2
30.4
25.8
3.7
3.4
12.2
13.1
1.5
1.4
VATech Wabag
Buy
480
681
2,618
3,136
3,845
8.9
9.1
26.0
35.9
18.5
13.4
2.3
2.0
13.4
15.9
0.7
0.6
Cement
ACC
Neutral
1,320
-
24,793
11,225
13,172
13.2
16.9
44.5
75.5
29.7
17.5
2.8
2.6
11.2
14.2
2.2
1.9
Ambuja Cements
Neutral
212
-
42,106
9,350
10,979
18.2
22.5
5.8
9.5
36.6
22.3
3.1
2.8
10.2
12.5
4.4
3.7
India Cements
Neutral
122
-
3,745
4,364
4,997
18.5
19.2
7.9
11.3
15.4
10.8
1.1
1.1
8.0
8.5
1.6
1.4
JK Cement
Neutral
728
-
5,092
4,398
5,173
15.5
17.5
31.2
55.5
23.3
13.1
2.8
2.4
12.0
15.5
1.7
1.4
J K Lakshmi Cement
Buy
365
565
4,292
2,913
3,412
14.5
19.5
7.5
22.5
48.6
16.2
3.0
2.5
12.5
18.0
2.0
1.7
Orient Cement
Buy
127
215
2,600
2,114
2,558
18.5
20.5
8.1
11.3
15.7
11.2
2.3
2.0
9.0
14.0
1.8
1.4
UltraTech Cement
Neutral
3,299
-
90,545
25,768
30,385
21.0
23.5
111.0
160.0
29.7
20.6
3.8
3.3
13.5
15.8
3.6
2.9
Construction
ITNL
Neutral
113
-
3,717
8,946
10,017
31.0
31.6
8.1
9.1
14.0
12.4
0.5
0.5
4.2
5.0
3.7
3.4
KNR Constructions
Neutral
169
-
2,379
1,385
1,673
14.7
14.0
41.2
48.5
4.1
3.5
0.8
0.7
14.9
15.2
1.8
1.5
Larsen & Toubro
Buy
1,376
1,634
128,336
111,017
124,908
11.0
11.0
61.1
66.7
22.5
20.6
2.7
2.5
13.1
12.9
2.2
2.0
Gujarat Pipavav Port
Neutral
131
-
6,345
705
788
52.2
51.7
5.0
5.6
26.3
23.4
2.6
2.3
11.2
11.2
8.6
7.2
Nagarjuna Const.
Neutral
86
-
4,764
8,842
9,775
9.1
8.8
5.3
6.4
16.2
13.4
1.3
1.2
8.2
9.1
0.7
0.6
PNC Infratech
Buy
105
143
2,685
2,350
2,904
13.1
13.2
9.0
8.8
11.6
11.9
0.4
0.4
15.9
13.9
1.2
1.0
Simplex Infra
Neutral
290
-
1,434
6,829
7,954
10.5
10.5
31.4
37.4
9.2
7.8
1.0
0.9
9.9
13.4
0.6
0.5
Power Mech Projects
Neutral
440
-
647
1,801
2,219
12.7
14.6
72.1
113.9
6.1
3.9
1.1
1.0
16.8
11.9
0.4
0.3
Sadbhav Engineering
Accumulate
273
298
4,692
3,598
4,140
10.3
10.6
9.0
11.9
30.4
23.0
3.2
2.8
9.9
11.9
1.6
1.4
NBCC
Neutral
247
-
14,826
7,428
9,549
7.9
8.6
8.2
11.0
30.1
22.5
1.5
1.2
28.2
28.7
1.6
1.2
MEP Infra
Neutral
38
-
615
1,877
1,943
30.6
29.8
3.0
4.2
12.6
9.0
6.1
4.1
0.6
0.6
1.7
1.5
Stock Watch
January 05, 2017
Company Name
Reco
CMP
Target
Mkt Cap
Sales ( Čcr )
OPM(%)
EPS (Č)
PER(x)
P/BV(x)
RoE(%)
EV/Sales(x)
(Č)
Price ( Č)
( Č cr )
FY17E
FY18E
FY17E
FY18E
FY17E
FY18E
FY17E
FY18E
FY17E
FY18E
FY17E
FY18E
FY17E
FY18E
Construction
SIPL
Neutral
96
-
3,378
1,036
1,252
65.5
66.2
(8.4)
(5.6)
3.6
4.1
(22.8)
(15.9)
11.4
9.5
Engineers India
Neutral
154
-
10,361
1,725
1,935
16.0
19.1
11.4
13.9
13.5
11.1
1.9
1.8
13.4
15.3
4.8
4.3
Financials
Axis Bank
Buy
454
630
108,445
46,932
53,575
3.5
3.4
32.4
44.6
14.0
10.2
1.8
1.6
13.6
16.5
-
-
Bank of Baroda
Neutral
148
-
34,102
19,980
23,178
1.8
1.8
11.5
17.3
12.9
8.6
1.5
1.2
8.3
10.1
-
-
Canara Bank
Neutral
264
-
14,338
15,225
16,836
1.8
1.8
14.5
28.0
18.2
9.4
1.3
1.0
5.8
8.5
-
-
Dewan Housing Finance Buy
243
350
7,615
2,225
2,688
2.9
2.9
29.7
34.6
8.2
7.0
1.3
1.1
16.1
16.8
-
-
Equitas Holdings
Buy
149
235
4,984
939
1,281
11.7
11.5
5.8
8.2
25.6
18.1
2.2
2.0
10.9
11.5
-
-
Federal Bank
Neutral
66
-
11,322
9,353
10,623
2.9
2.9
4.4
5.8
15.0
11.3
1.4
1.3
9.5
11.0
-
-
HDFC
Neutral
1,213
-
192,169
11,475
13,450
3.4
3.4
45.3
52.5
26.8
23.1
5.2
4.6
20.2
20.5
-
-
HDFC Bank
Accumulate
1,186
1,350
302,811
46,097
55,433
4.5
4.5
58.4
68.0
20.3
17.4
3.6
3.0
18.8
18.6
-
-
ICICI Bank
Buy
251
315
146,153
42,800
44,686
3.1
3.3
18.0
21.9
14.0
11.5
1.9
1.8
11.1
12.3
-
-
Lakshmi Vilas Bank
Buy
139
174
2,496
3,339
3,799
2.7
2.8
11.0
14.0
12.7
9.9
1.3
1.2
11.2
12.7
-
-
LIC Housing Finance
Accumulate
518
630
26,149
3,712
4,293
2.6
2.5
39.0
46.0
13.3
11.3
2.5
2.1
19.9
20.1
-
-
Punjab Natl.Bank
Neutral
115
-
24,514
23,532
23,595
2.3
2.4
6.8
12.6
16.9
9.1
2.6
1.9
3.3
6.5
-
-
RBL Bank
Neutral
346
-
12,779
1,783
2,309
2.6
2.6
12.7
16.4
27.2
21.1
3.0
2.7
12.8
13.3
-
-
South Ind.Bank
Neutral
20
-
2,703
6,435
7,578
2.5
2.5
2.7
3.1
7.4
6.5
1.0
0.8
10.1
11.2
-
-
St Bk of India
Neutral
243
-
188,558
88,650
98,335
2.6
2.6
13.5
18.8
18.0
12.9
1.7
1.5
7.0
8.5
-
-
Union Bank
Neutral
125
-
8,624
13,450
14,925
2.3
2.3
25.5
34.5
4.9
3.6
0.7
0.6
7.5
10.2
-
-
Yes Bank
Neutral
1,163
-
49,202
8,978
11,281
3.3
3.4
74.0
90.0
15.7
12.9
3.0
2.5
17.0
17.2
-
-
FMCG
Asian Paints
Neutral
906
-
86,918
17,128
18,978
16.8
16.4
19.1
20.7
47.4
43.8
16.5
15.6
34.8
35.5
4.9
4.4
Britannia
Buy
2,851
3,626
34,212
9,594
11,011
14.6
14.9
80.3
94.0
35.5
30.3
14.6
11.3
41.2
-
3.5
3.0
Colgate
Accumulate
895
995
24,351
4,605
5,149
23.4
23.4
23.8
26.9
37.6
33.3
20.8
16.3
64.8
66.8
5.3
4.7
Dabur India
Accumulate
277
304
48,715
8,315
9,405
19.8
20.7
8.1
9.2
34.1
30.1
9.5
7.9
31.6
31.0
5.5
4.9
GlaxoSmith Con*
Neutral
5,058
-
21,273
4,350
4,823
21.2
21.4
179.2
196.5
28.2
25.8
7.5
6.4
27.1
26.8
4.2
3.7
Godrej Consumer
Neutral
1,532
-
52,175
10,235
11,428
18.4
18.6
41.1
44.2
37.3
34.7
8.3
7.0
24.9
24.8
5.1
4.5
HUL
Neutral
821
-
177,687
35,252
38,495
17.8
17.8
20.7
22.4
39.8
36.7
38.0
32.6
95.6
88.9
4.9
4.5
ITC
Buy
245
284
296,610
40,059
44,439
38.3
39.2
9.0
10.1
27.3
24.1
7.6
6.6
27.8
27.5
6.8
6.1
Marico
Buy
258
300
33,231
6,430
7,349
18.8
19.5
6.4
7.7
40.2
33.5
12.2
10.2
33.2
32.5
5.0
4.4
Nestle*
Neutral
5,893
-
56,815
10,073
11,807
20.7
21.5
124.8
154.2
47.2
38.2
19.4
17.4
34.8
36.7
5.6
4.7
Stock Watch
January 05, 2017
Company Name
Reco
CMP
Target
Mkt Cap
Sales ( Čcr )
OPM(%)
EPS (Č)
PER(x)
P/BV(x)
RoE(%)
EV/Sales(x)
(Č)
Price ( Č)
( Č cr )
FY17E FY18E
FY17E
FY18E
FY17E
FY18E
FY17E
FY18E
FY17E
FY18E
FY17E
FY18E
FY17E
FY18E
FMCG
Tata Global
Neutral
124
-
7,854
8,675
9,088
9.8
9.8
7.4
8.2
16.8
15.2
1.9
1.8
7.9
8.1
0.8
0.8
Procter & Gamble
Neutral
6,900
-
22,398
2,939
3,342
23.2
23.0
146.2
163.7
47.2
42.2
105.7
101.3
25.3
23.5
7.3
6.4
Hygiene
IT
HCL Tech^
Buy
859
1,000
121,225
49,242
57,168
20.5
20.5
55.7
64.1
15.4
13.4
3.1
2.4
20.3
17.9
2.2
1.8
Infosys
Buy
998
1,249
229,304
68,350
77,326
27.0
27.0
62.5
69.4
16.0
14.4
3.4
3.1
21.3
21.6
2.8
2.5
TCS
Accumulate
2,379
2,620
468,676
119,025
133,308
27.6
27.6
131.2
145.5
18.1
16.4
5.9
5.4
32.4
33.1
3.7
3.3
Tech Mahindra
Buy
500
600
48,627
29,673
32,937
15.5
17.0
32.8
39.9
15.2
12.5
3.0
2.6
19.6
20.7
1.3
1.1
Wipro
Buy
476
590
115,649
55,440
60,430
18.1
18.1
35.9
39.9
13.3
11.9
2.4
2.2
19.0
19.3
1.8
1.6
Media
D B Corp
Neutral
374
-
6,884
2,297
2,590
27.4
28.2
21.0
23.4
17.8
16.0
4.2
3.6
23.7
23.1
2.7
2.3
HT Media
Neutral
75
-
1,734
2,693
2,991
12.6
12.9
7.9
9.0
9.4
8.3
0.8
0.7
7.8
8.3
0.2
0.1
Jagran Prakashan
Buy
181
225
5,912
2,355
2,635
28.0
28.0
10.8
12.5
16.7
14.5
3.6
3.1
21.7
21.7
2.5
2.2
Sun TV Network
Neutral
524
-
20,634
2,850
3,265
70.1
71.0
26.2
30.4
20.0
17.2
5.1
4.5
24.3
25.6
6.4
5.5
Hindustan Media
Neutral
270
-
1,985
1,016
1,138
24.3
25.2
27.3
30.1
9.9
9.0
1.9
1.7
16.2
15.8
1.2
1.1
Ventures
TV Today Network
Buy
281
385
1,674
637
743
27.5
27.5
18.4
21.4
15.3
13.1
2.7
2.3
17.4
17.2
2.1
1.7
Metals & Mining
Coal India
Neutral
306
-
190,102
84,638
94,297
21.4
22.3
24.5
27.1
12.5
11.3
5.2
5.0
42.6
46.0
1.7
1.5
Hind. Zinc
Neutral
251
-
106,119
14,252
18,465
55.9
48.3
15.8
21.5
15.9
11.7
2.6
2.3
17.0
20.7
7.6
5.9
Hindalco
Neutral
159
-
32,831
107,899
112,095
7.4
8.2
9.2
13.0
17.3
12.2
0.8
0.8
4.8
6.6
0.8
0.8
JSW Steel
Neutral
163
-
39,401
53,201
58,779
16.1
16.2
130.6
153.7
1.3
1.1
0.2
0.2
14.0
14.4
1.5
1.3
NMDC
Neutral
134
-
42,459
6,643
7,284
44.4
47.7
7.1
7.7
18.9
17.4
1.6
1.6
8.8
9.2
3.6
3.3
SAIL
Neutral
51
-
20,878
47,528
53,738
(0.7)
2.1
(1.9)
2.6
19.4
0.6
0.5
(1.6)
3.9
1.3
1.2
Vedanta
Neutral
217
-
64,275
71,744
81,944
19.2
21.7
13.4
20.1
16.2
10.8
1.4
1.2
8.4
11.3
1.3
1.0
Tata Steel
Neutral
405
-
39,344
121,374
121,856
7.2
8.4
18.6
34.3
21.8
11.8
1.4
1.2
6.1
10.1
1.0
0.9
Oil & Gas
Cairn India
Neutral
243
-
45,668
9,127
10,632
4.3
20.6
8.8
11.7
27.7
20.8
0.9
0.9
3.3
4.2
6.4
5.4
GAIL
Neutral
440
-
55,762
56,220
65,198
9.3
10.1
27.1
33.3
16.2
13.2
1.5
1.4
9.3
10.7
1.2
1.0
ONGC
Neutral
194
-
249,414
137,222
152,563
15.0
21.8
19.5
24.1
10.0
8.1
0.9
0.8
8.5
10.1
2.1
1.9
Indian Oil Corp
Neutral
343
-
166,533
373,359
428,656
5.9
5.5
54.0
59.3
6.4
5.8
1.0
0.9
16.0
15.6
0.6
0.5
Reliance Industries
Neutral
1,069
-
346,724
301,963
358,039
12.1
12.6
87.7
101.7
12.2
10.5
1.3
1.1
10.7
11.3
1.6
1.4
Pharmaceuticals
Alembic Pharma
Neutral
605
-
11,404
3,483
4,083
20.2
21.4
24.3
30.4
24.9
19.9
5.7
4.5
25.5
25.3
3.2
2.6
Alkem Laboratories Ltd
Buy
1,667
1,989
19,936
6,043
6,893
18.7
19.3
80.5
88.8
20.7
18.8
4.6
3.8
22.3
20.3
3.1
2.7
Aurobindo Pharma
Buy
666
877
38,969
15,720
18,078
23.7
23.7
41.4
47.3
16.1
14.1
4.2
3.3
29.6
26.1
2.7
2.4
Stock Watch
January 05, 2017
Company Name
Reco
CMP
Target
Mkt Cap
Sales ( Čcr )
OPM(%)
EPS (Č)
PER(x)
P/BV(x)
RoE(%)
EV/Sales(x)
(Č)
Price ( Č)
( Č cr )
FY17E FY18E
FY17E
FY18E
FY17E
FY18E
FY17E
FY18E
FY17E
FY18E
FY17E
FY18E
FY17E
FY18E
Pharmaceuticals
Sanofi India*
Neutral
4,290
-
9,880
2,277
2,597
17.3
18.3
149.4
172.0
28.7
24.9
4.8
3.8
25.1
28.8
4.0
3.3
Cadila Healthcare
Accumulate
362
400
37,039
10,429
12,318
22.6
22.0
16.9
19.2
21.4
18.8
5.5
4.4
28.5
25.7
3.5
2.9
Cipla
Reduce
568
490
45,698
15,378
18,089
17.4
18.4
21.6
27.2
26.3
20.9
3.4
3.0
13.7
15.2
3.2
2.6
Dr Reddy's
Neutral
3,091
-
51,201
16,043
18,119
20.8
22.4
112.4
142.9
27.5
21.6
3.7
3.2
14.1
15.9
3.1
2.8
Dishman Pharma
Neutral
226
-
3,651
1,718
1,890
22.7
22.8
9.5
11.3
23.8
20.0
2.3
2.1
10.1
10.9
2.5
2.2
GSK Pharma*
Neutral
2,747
-
23,267
3,000
3,312
15.4
20.6
46.5
60.8
59.1
45.2
14.2
14.1
26.3
30.6
7.4
6.8
Indoco Remedies
Reduce
269
240
2,478
1,112
1,289
16.2
18.2
11.6
16.0
23.2
16.8
3.7
3.1
17.0
20.1
2.3
1.9
Ipca labs
Buy
550
613
6,936
3,303
3,799
15.3
15.3
17.3
19.7
31.8
27.9
2.8
2.5
9.1
9.4
2.2
1.9
Lupin
Buy
1,494
1,809
67,459
15,912
18,644
26.4
26.7
58.1
69.3
25.7
21.6
5.0
4.1
21.4
20.9
4.3
3.5
Sun Pharma
Buy
638
847
152,974
31,129
35,258
32.0
32.9
30.2
35.3
21.1
18.1
3.4
2.8
20.0
20.1
4.4
3.7
Power
Tata Power
Neutral
76
-
20,501
36,916
39,557
17.4
27.1
5.1
6.3
14.9
12.0
1.3
1.2
9.0
10.3
1.6
1.4
NTPC
Neutral
165
-
135,885
86,605
95,545
17.5
20.8
11.8
13.4
14.0
12.3
1.4
1.3
10.5
11.1
2.9
2.9
Power Grid
Buy
186
223
97,386
25,315
29,193
88.2
88.7
14.2
17.2
13.2
10.9
2.0
1.7
15.2
16.1
8.4
7.6
Real Estate
MLIFE
Buy
362
522
1,484
1,152
1,300
22.7
24.6
29.9
35.8
12.1
10.1
0.9
0.8
7.6
8.6
2.0
1.6
Telecom
Bharti Airtel
Neutral
314
-
125,598
105,086
114,808
34.5
34.7
12.2
16.4
25.8
19.2
1.7
1.6
6.8
8.4
2.1
1.8
Idea Cellular
Neutral
74
-
26,686
40,133
43,731
37.2
37.1
6.4
6.5
11.6
11.4
1.0
0.9
8.2
7.6
1.7
1.4
zOthers
Abbott India
Neutral
4,610
-
9,796
3,153
3,583
14.1
14.4
152.2
182.7
30.3
25.2
148.7
127.0
25.6
26.1
2.9
2.5
Bajaj Electricals
Buy
227
274
2,293
4,801
5,351
5.7
6.2
10.4
13.7
21.7
16.6
2.7
2.4
12.4
14.5
0.5
0.4
Finolex Cables
Neutral
412
-
6,294
2,883
3,115
12.0
12.1
14.2
18.6
29.0
22.1
15.4
13.5
15.8
14.6
1.9
1.7
Goodyear India*
Neutral
717
-
1,653
1,598
1,704
10.4
10.2
49.4
52.6
14.5
13.6
67.0
58.8
18.2
17.0
0.6
88.6
Hitachi
Neutral
1,370
-
3,725
2,081
2,433
8.8
8.9
33.4
39.9
41.0
34.3
33.1
27.6
22.1
21.4
1.8
1.5
Jyothy Laboratories
Neutral
335
-
6,088
1,440
2,052
11.5
13.0
8.5
10.0
39.4
33.5
9.6
8.8
18.6
19.3
4.5
3.2
Page Industries
Neutral
13,782
-
15,373
2,450
3,124
20.1
17.6
299.0
310.0
46.1
44.5
307.0
234.3
47.1
87.5
6.3
5.0
Relaxo Footwears
Neutral
401
-
4,815
2,085
2,469
9.2
8.2
7.6
8.0
53.0
50.4
20.6
17.6
17.9
18.8
2.4
2.1
Siyaram Silk Mills
Accumulate
1,390
1,605
1,303
1,733
1,948
11.6
11.7
96.6
114.7
14.4
12.1
2.2
1.9
15.3
15.7
0.9
0.8
Styrolution ABS India*
Neutral
605
-
1,064
1,440
1,537
9.2
9.0
40.6
42.6
14.9
14.2
38.1
34.6
12.3
11.6
0.7
0.6
TVS Srichakra
Neutral
3,256
-
2,493
2,304
2,614
13.7
13.8
231.1
266.6
14.1
12.2
365.8
288.1
33.9
29.3
1.1
0.9
HSIL
Neutral
280
-
2,028
2,384
2,515
15.8
16.3
15.3
19.4
18.3
14.5
18.2
15.7
7.8
9.3
1.0
0.9
Kirloskar Engines India
Neutral
325
-
4,704
2,554
2,800
9.9
10.0
10.5
12.1
31.0
26.9
13.0
12.2
10.7
11.7
1.5
1.3
Ltd
Stock Watch
January 05, 2017
Company Name
Reco
CMP
Target
Mkt Cap
Sales ( Čcr )
OPM(%)
EPS (Č)
PER(x)
P/BV(x)
RoE(%)
EV/Sales(x)
(Č)
Price ( Č)
( Č cr )
FY17E
FY18E
FY17E
FY18E
FY17E
FY18E
FY17E
FY18E
FY17E
FY18E
FY17E
FY18E
FY17E
FY18E
zOthers
M M Forgings
Neutral
436
-
526
546
608
20.4
20.7
41.3
48.7
10.6
9.0
59.7
52.9
16.6
17.0
0.8
0.7
Banco Products (India) Neutral
195
-
1,395
1,353
1,471
12.3
12.4
14.5
16.3
13.5
12.0
18.6
16.7
14.5
14.6
0.9
100.2
Competent Automobiles Neutral
162
-
100
1,137
1,256
3.1
2.7
28.0
23.6
5.8
6.9
31.2
28.2
14.3
11.5
0.1
0.1
Nilkamal
Neutral
1,420
-
2,119
1,995
2,165
10.7
10.4
69.8
80.6
20.4
17.6
81.2
70.5
16.6
16.5
0.9
0.8
Visaka Industries
Neutral
197
-
312
1,051
1,138
10.3
10.4
21.0
23.1
9.4
8.5
25.2
23.6
9.0
9.2
0.5
0.5
Transport Corporation of
Neutral
154
-
1,176
2,671
2,911
8.5
8.8
13.9
15.7
11.1
9.8
1.5
1.4
13.7
13.8
0.5
0.5
India
Elecon Engineering
Neutral
57
-
637
1,482
1,660
13.7
14.5
3.9
5.8
14.6
9.8
3.4
3.1
7.8
10.9
0.8
0.7
Surya Roshni
Neutral
182
-
796
3,342
3,625
7.8
7.5
17.3
19.8
10.5
9.2
20.0
16.0
10.5
10.8
0.5
0.4
MT Educare
Neutral
125
-
498
366
417
17.7
18.2
9.4
10.8
13.3
11.6
3.0
2.6
22.2
22.3
1.2
1.0
Radico Khaitan
Buy
117
147
1,558
1,667
1,824
13.0
13.2
6.7
8.2
17.6
14.3
1.6
1.5
9.0
10.2
1.3
1.1
Garware Wall Ropes
Neutral
613
-
1,341
873
938
14.3
14.3
35.2
37.5
17.4
16.4
3.1
2.6
17.5
15.9
1.4
1.3
Wonderla Holidays
Neutral
339
-
1,913
287
355
38.0
40.0
11.3
14.2
30.0
23.9
4.3
3.8
21.4
23.9
6.4
5.2
Linc Pen & Plastics
Neutral
232
-
343
382
420
9.3
9.5
13.5
15.7
17.2
14.8
3.0
2.6
17.1
17.3
1.0
0.9
The Byke Hospitality
Neutral
170
-
682
287
384
20.5
20.5
7.6
10.7
22.4
15.9
4.7
3.8
20.7
23.5
2.3
1.7
Interglobe Aviation
Neutral
843
-
30,486
21,122
26,005
14.5
27.6
110.7
132.1
7.6
6.4
45.6
32.6
168.5
201.1
1.4
1.1
Coffee Day Enterprises
Neutral
198
-
4,072
2,964
3,260
20.5
21.2
4.7
8.0
-
24.7
2.3
2.1
5.5
8.5
1.8
1.6
Ltd
Navneet Education
Neutral
120
-
2,855
1,062
1,147
24.0
24.0
6.1
6.6
19.7
18.1
4.0
3.6
20.6
19.8
2.6
2.4
Navkar Corporation
Buy
169
265
2,405
369
561
42.9
42.3
7.2
11.5
23.4
14.6
1.7
1.5
7.4
10.5
7.4
4.9
UFO Moviez
Neutral
416
-
1,148
619
685
33.2
33.4
30.0
34.9
13.9
11.9
1.9
1.7
13.8
13.9
1.5
1.2
VRL Logistics
Neutral
266
-
2,430
1,902
2,119
16.7
16.6
14.6
16.8
18.3
15.8
4.0
3.5
21.9
22.2
1.4
1.2
Team Lease Serv.
Neutral
885
-
1,514
3,229
4,001
1.5
1.8
22.8
32.8
38.9
27.0
4.2
3.6
10.7
13.4
0.4
0.3
S H Kelkar & Co.
Neutral
335
-
4,851
1,036
1,160
15.1
15.0
6.1
7.2
54.9
46.7
5.9
5.4
10.7
11.5
4.2
3.7
Quick Heal
Neutral
265
-
1,854
408
495
27.3
27.0
7.7
8.8
34.2
30.1
3.2
3.2
9.3
10.6
3.5
2.9
Narayana Hrudaya
Neutral
335
-
6,844
1,873
2,166
11.5
11.7
2.6
4.0
126.6
84.5
7.8
7.0
6.1
8.3
3.9
3.3
Manpasand Bever.
Neutral
552
-
3,159
836
1,087
19.6
19.4
16.9
23.8
32.7
23.2
3.9
3.4
12.0
14.8
3.5
2.6
Parag Milk Foods
Neutral
263
-
2,212
1,919
2,231
9.3
9.6
9.5
12.9
27.8
20.3
4.3
3.6
15.5
17.5
1.3
1.1
Mirza International
Buy
91
107
1,089
987
1,106
18.0
18.0
6.5
7.6
13.9
11.9
2.2
1.9
15.9
15.7
1.2
1.1
Asian Granito
Buy
237
351
713
1,071
1,182
12.1
12.4
12.7
16.0
18.6
14.9
1.8
1.6
9.5
10.7
0.9
0.8
Source: Company, Angel Research; Note: *December year end; #September year end; &October year end; Price as on January 04, 2017
Market Outlook
January 05, 2017
Research Team Tel: 022 - 39357800
DISCLAIMER
Angel Broking Private Limited (hereinafter referred to as “Angel”) is a registered Member of National Stock Exchange of India Limited,
Bombay Stock Exchange Limited and Metropolitan Stock Exchange Limited. It is also registered as a Depository Participant with CDSL
and Portfolio Manager with SEBI. It also has registration with AMFI as a Mutual Fund Distributor. Angel Broking Private Limited is a
registered entity with SEBI for Research Analyst in terms of SEBI (Research Analyst) Regulations, 2014 vide registration number
INH000000164. Angel or its associates has not been debarred/ suspended by SEBI or any other regulatory authority for accessing
/dealing in securities Market. Angel or its associates/analyst has not received any compensation / managed or co-managed public
offering of securities of the company covered by Analyst during the past twelve months.
This document is solely for the personal information of the recipient, and must not be singularly used as the basis of any investment
decision. Nothing in this document should be construed as investment or financial advice. Each recipient of this document should make
such investigations as they deem necessary to arrive at an independent evaluation of an investment in the securities of the companies
referred to in this document (including the merits and risks involved), and should consult their own advisors to determine the merits and
risks of such an investment.
Reports based on technical and derivative analysis center on studying charts of a stock's price movement, outstanding positions and
trading volume, as opposed to focusing on a company's fundamentals and, as such, may not match with a report on a company's
fundamentals. Investors are advised to refer the Fundamental and Technical Research Reports available on our website to evaluate the
contrary view, if any.
The information in this document has been printed on the basis of publicly available information, internal data and other reliable
sources believed to be true, but we do not represent that it is accurate or complete and it should not be relied on as such, as this
document is for general guidance only. Angel Broking Pvt. Limited or any of its affiliates/ group companies shall not be in any way
responsible for any loss or damage that may arise to any person from any inadvertent error in the information contained in this report.
Angel Broking Pvt. Limited has not independently verified all the information contained within this document. Accordingly, we cannot
testify, nor make any representation or warranty, express or implied, to the accuracy, contents or data contained within this document.
While Angel Broking Pvt. Limited endeavors to update on a reasonable basis the information discussed in this material, there may be
regulatory, compliance, or other reasons that prevent us from doing so.
This document is being supplied to you solely for your information, and its contents, information or data may not be reproduced,
redistributed or passed on, directly or indirectly.
Neither Angel Broking Pvt. Limited, nor its directors, employees or affiliates shall be liable for any loss or damage that may arise from
or in connection with the use of this information.